Copyright (C) 2024 - 2026 ANSYS, Inc. and/or its affiliates. SPDX-License-Identifier: Apache-2.0
Licensed under the Apache License, Version 2.0 (the “License”); you may not use this file except in compliance with the License. You may obtain a copy of the License at
http://www.apache.org/licenses/LICENSE-2.0
Unless required by applicable law or agreed to in writing, software distributed under the License is distributed on an “AS IS” BASIS, WITHOUT WARRANTIES OR CONDITIONS OF ANY KIND, either express or implied. See the License for the specific language governing permissions and limitations under the License.
Read RCS metadata#
This example demonstrates how to use the ToolkitBackend class. It initiates AEDT through PyAEDT, opens an HFSS design, and proceeds to get the RCS data.
Perform required imports#
[1]:
from ansys.aedt.toolkits.radar_explorer.rcs_visualization import MonostaticRCSData
from ansys.aedt.toolkits.radar_explorer.rcs_visualization import MonostaticRCSPlotter
Get metadata#
[2]:
metadata = r"..\example_models\rcs_data\VV_Trihedral_RCS.json"
Load RCS#
[3]:
rcs_data = MonostaticRCSData(metadata)
Get RCS data#
[4]:
data_active_frequency = rcs_data.rcs_active_frequency
data_active_theta = rcs_data.rcs_active_theta
data_active_phi = rcs_data.rcs_active_phi
data_active_theta_phi = rcs_data.rcs_active_theta_phi
data = rcs_data.rcs
Load RCS plotter#
[5]:
rcs_data_plotter = MonostaticRCSPlotter(rcs_data)
Plot incident first incident wave theta#
[6]:
primary_sweep = "IWavePhi"
secondary_sweep_value = rcs_data.available_incident_wave_theta[0]
Plot RCS#
[7]:
freq = rcs_data_plotter.rcs_data.frequency
rcs_plot_1 = rcs_data_plotter.plot_rcs(
    primary_sweep=primary_sweep, secondary_sweep_value=secondary_sweep_value, title=f"Monostatic {freq} GHz", show=False
)
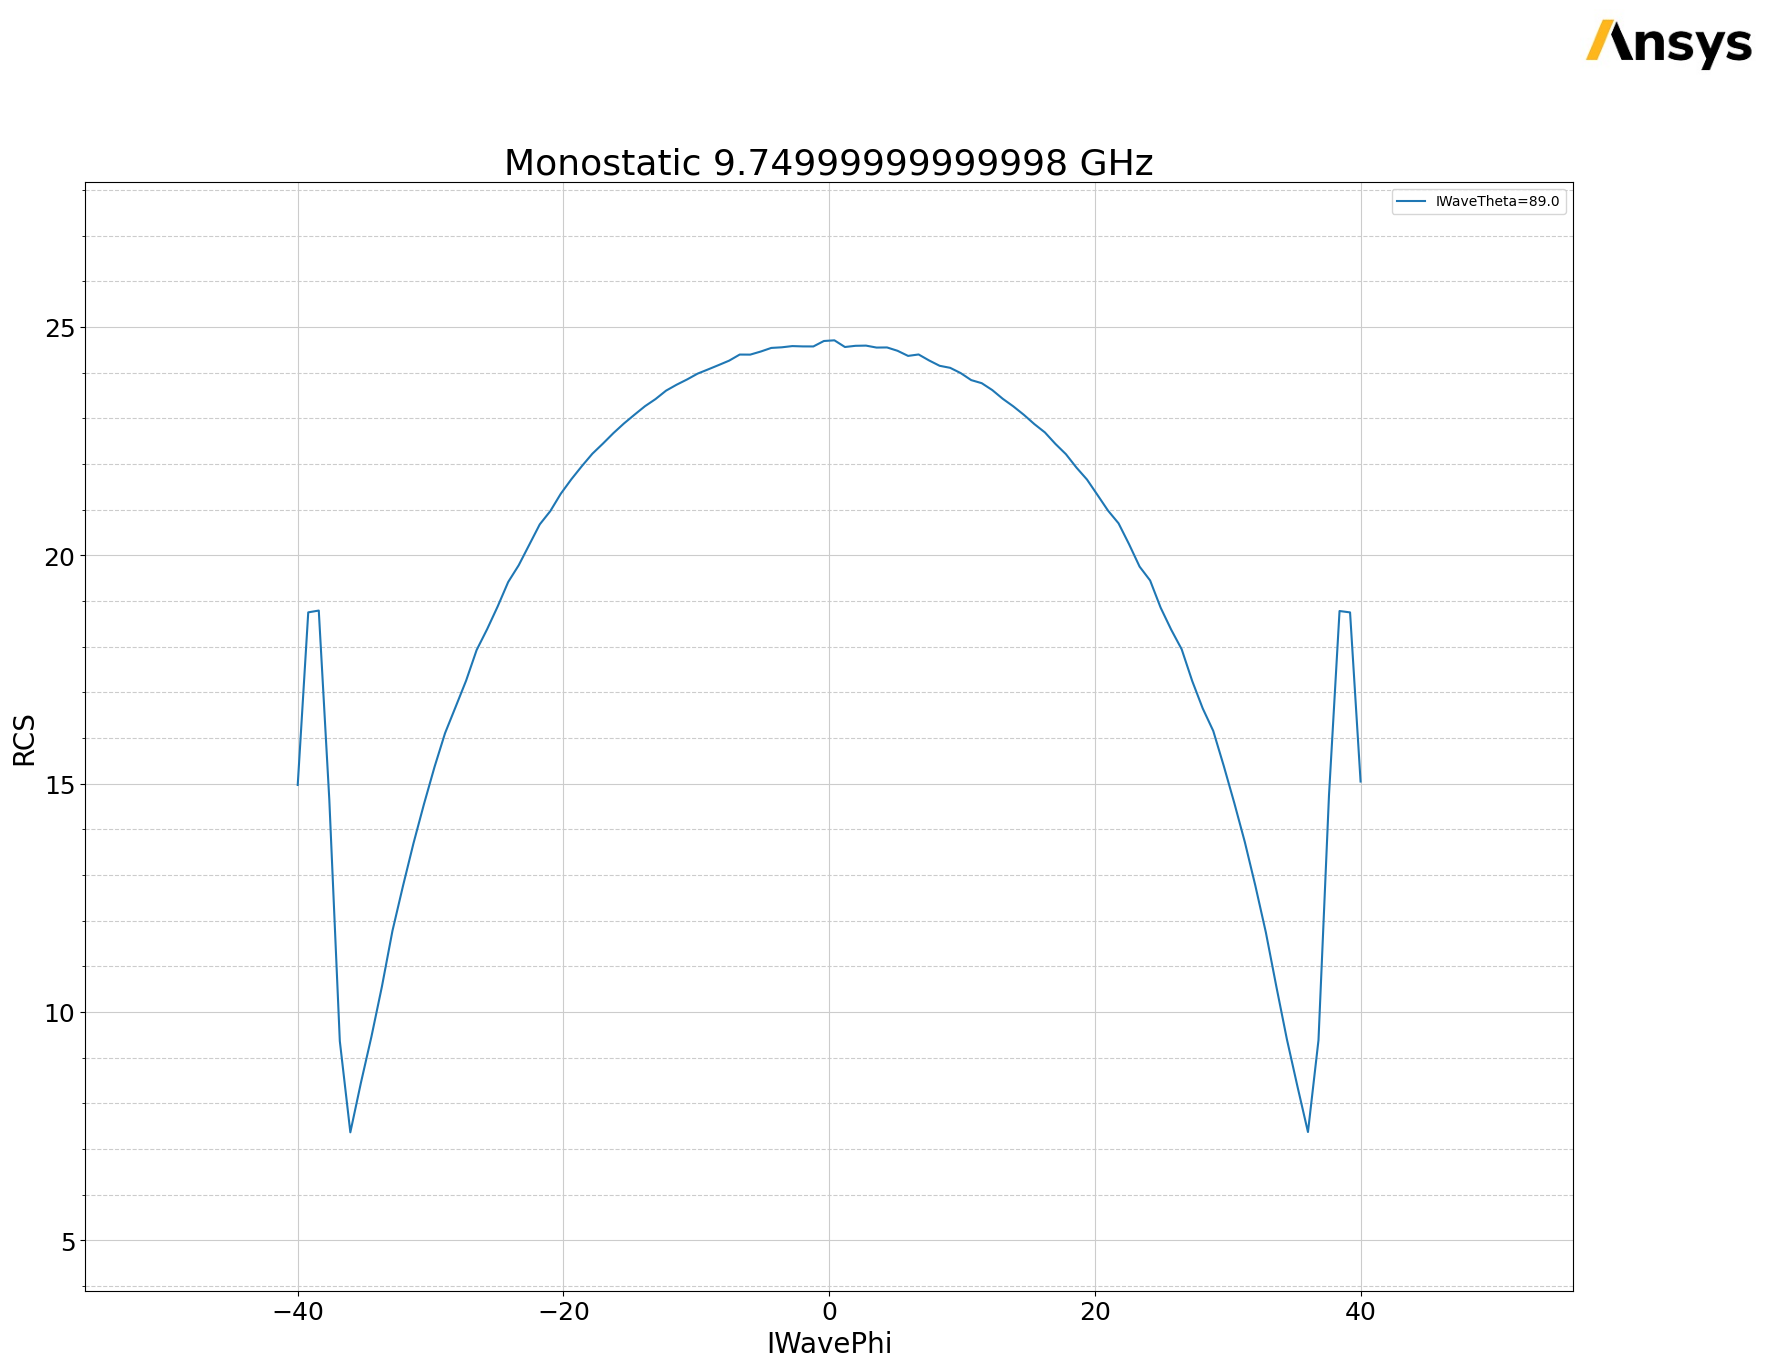
Plot last frequency RCS#
[8]:
rcs_data_plotter.rcs_data.frequency = rcs_data_plotter.rcs_data.frequencies[-1]
freq = rcs_data_plotter.rcs_data.frequency
rcs_plot_2 = rcs_data_plotter.plot_rcs(
    primary_sweep=primary_sweep, secondary_sweep_value=secondary_sweep_value, title=f"Monostatic {freq} GHz"
)

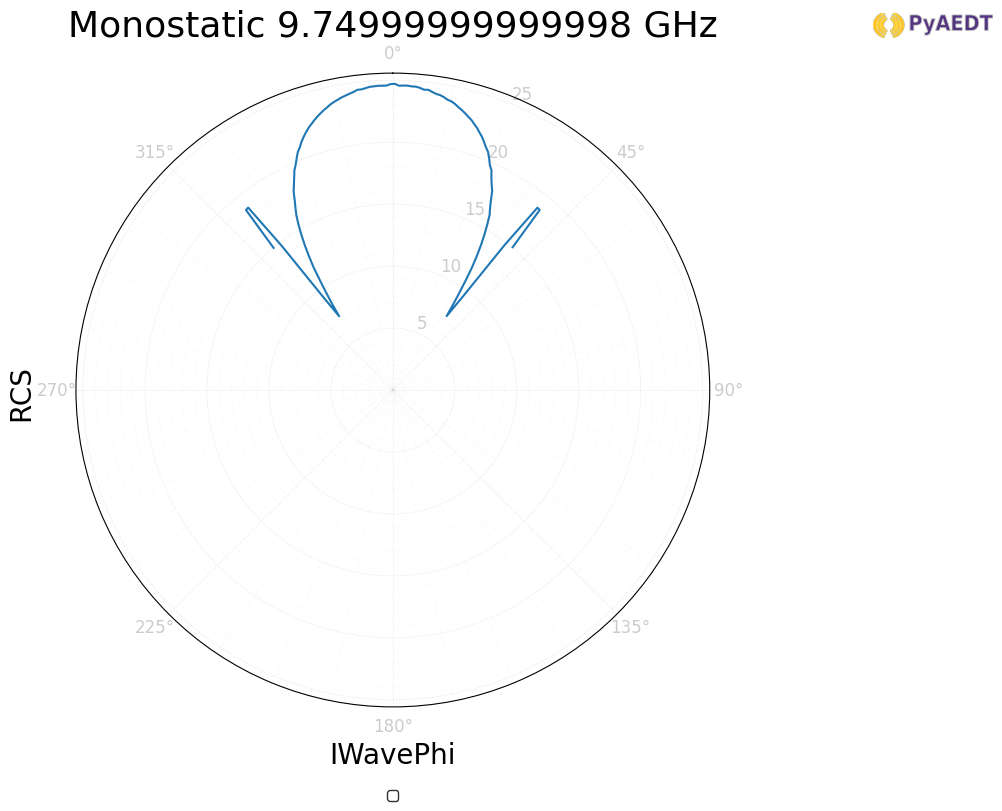
Plot polar RCS#
[9]:
rcs_data_plotter.rcs_data.frequency = rcs_data_plotter.rcs_data.frequencies[0]
freq = rcs_data_plotter.rcs_data.frequency
rcs_plot_polar = rcs_data_plotter.plot_rcs(
    primary_sweep=primary_sweep,
    secondary_sweep_value=secondary_sweep_value,
    is_polar=True,
    title=f"Monostatic {freq} GHz",
)
C:\actions-runner\_work\ansys-aedt-toolkits-radar-explorer\ansys-aedt-toolkits-radar-explorer\.venv\Lib\site-packages\ansys\aedt\core\visualization\plot\matplotlib.py:1216: UserWarning: No artists with labels found to put in legend.  Note that artists whose label start with an underscore are ignored when legend() is called with no argument.
  self.legend = self.ax.legend(
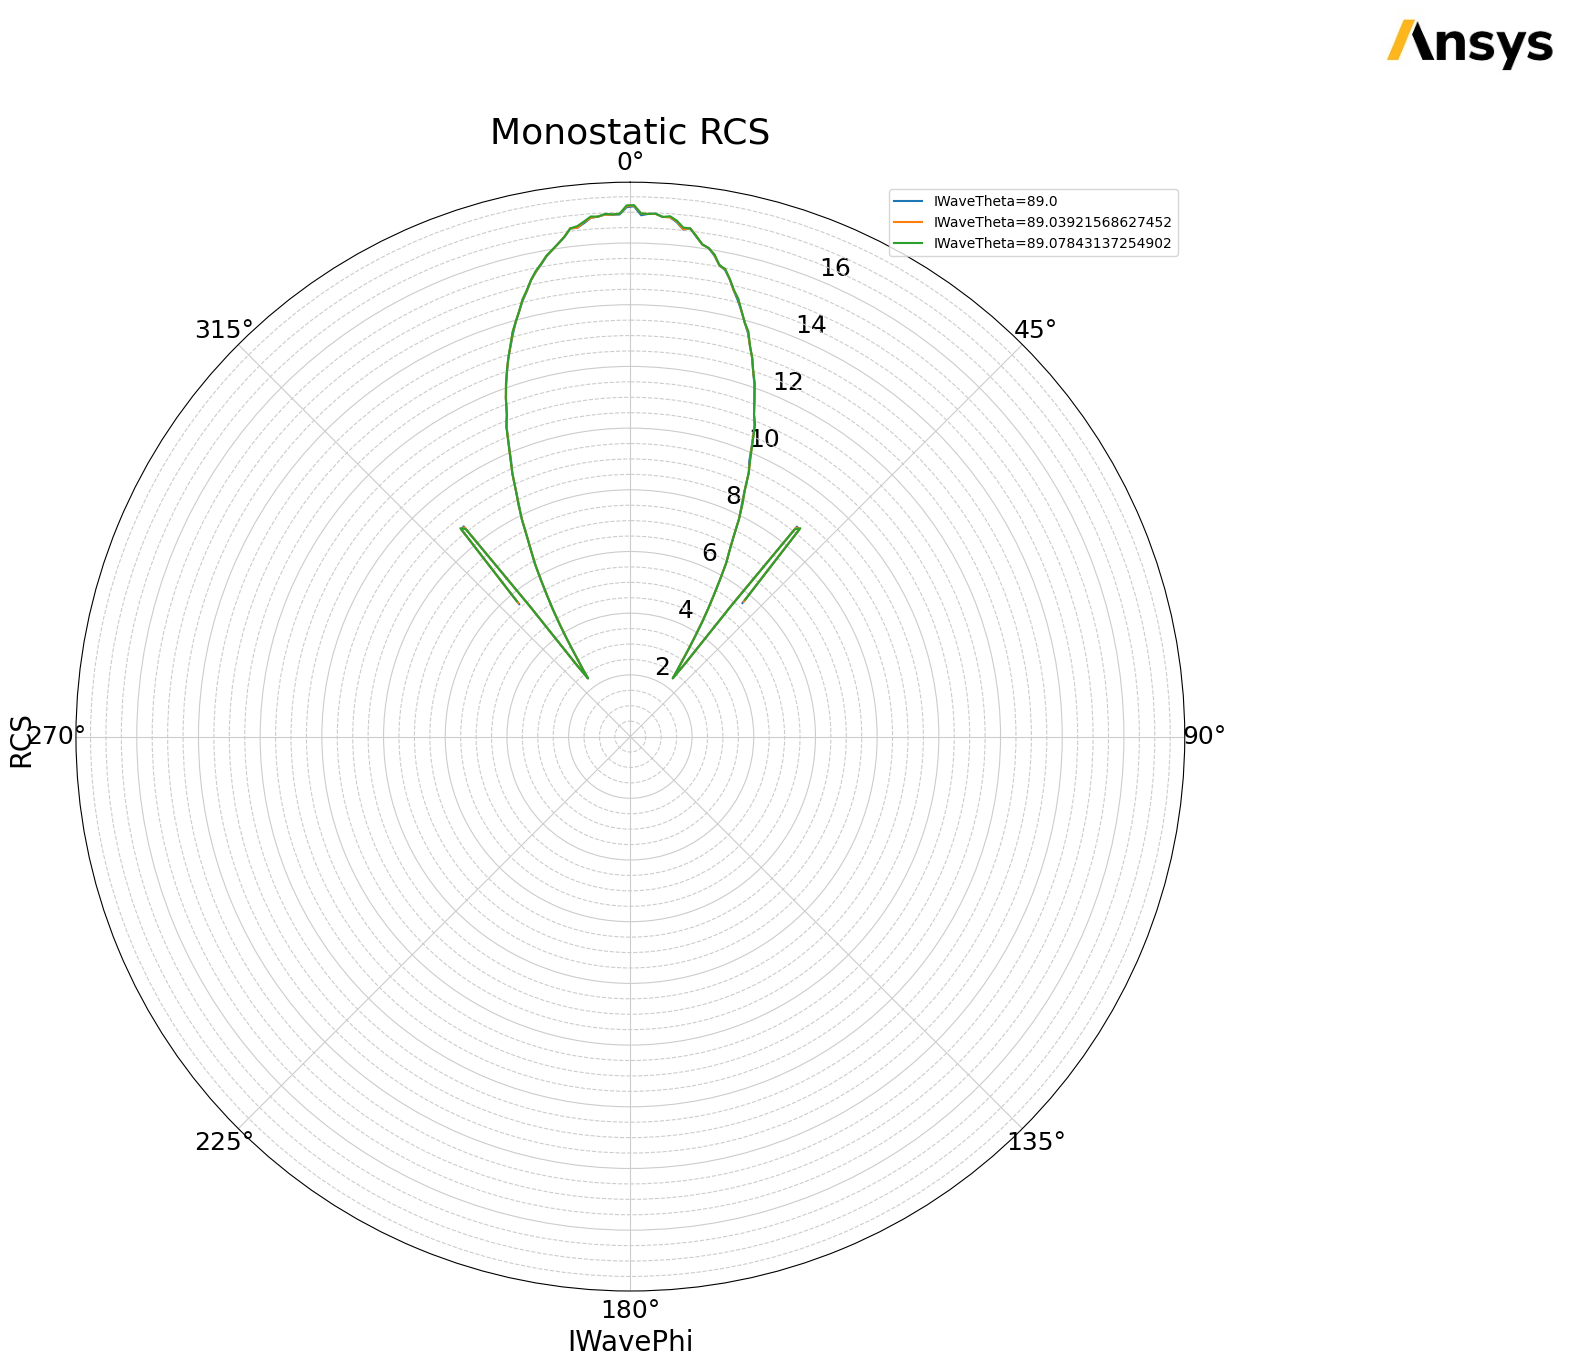
Plot three incident wave theta#
[10]:
primary_sweep = "IWavePhi"
secondary_sweep_value = rcs_data_plotter.rcs_data.available_incident_wave_theta[0:3]
rcs_data_plotter.rcs_data.data_conversion_function = "abs"
Plot RCS
[11]:
rcs_plot_3 = rcs_data_plotter.plot_rcs(
    primary_sweep=primary_sweep, secondary_sweep_value=secondary_sweep_value, is_polar=True
)
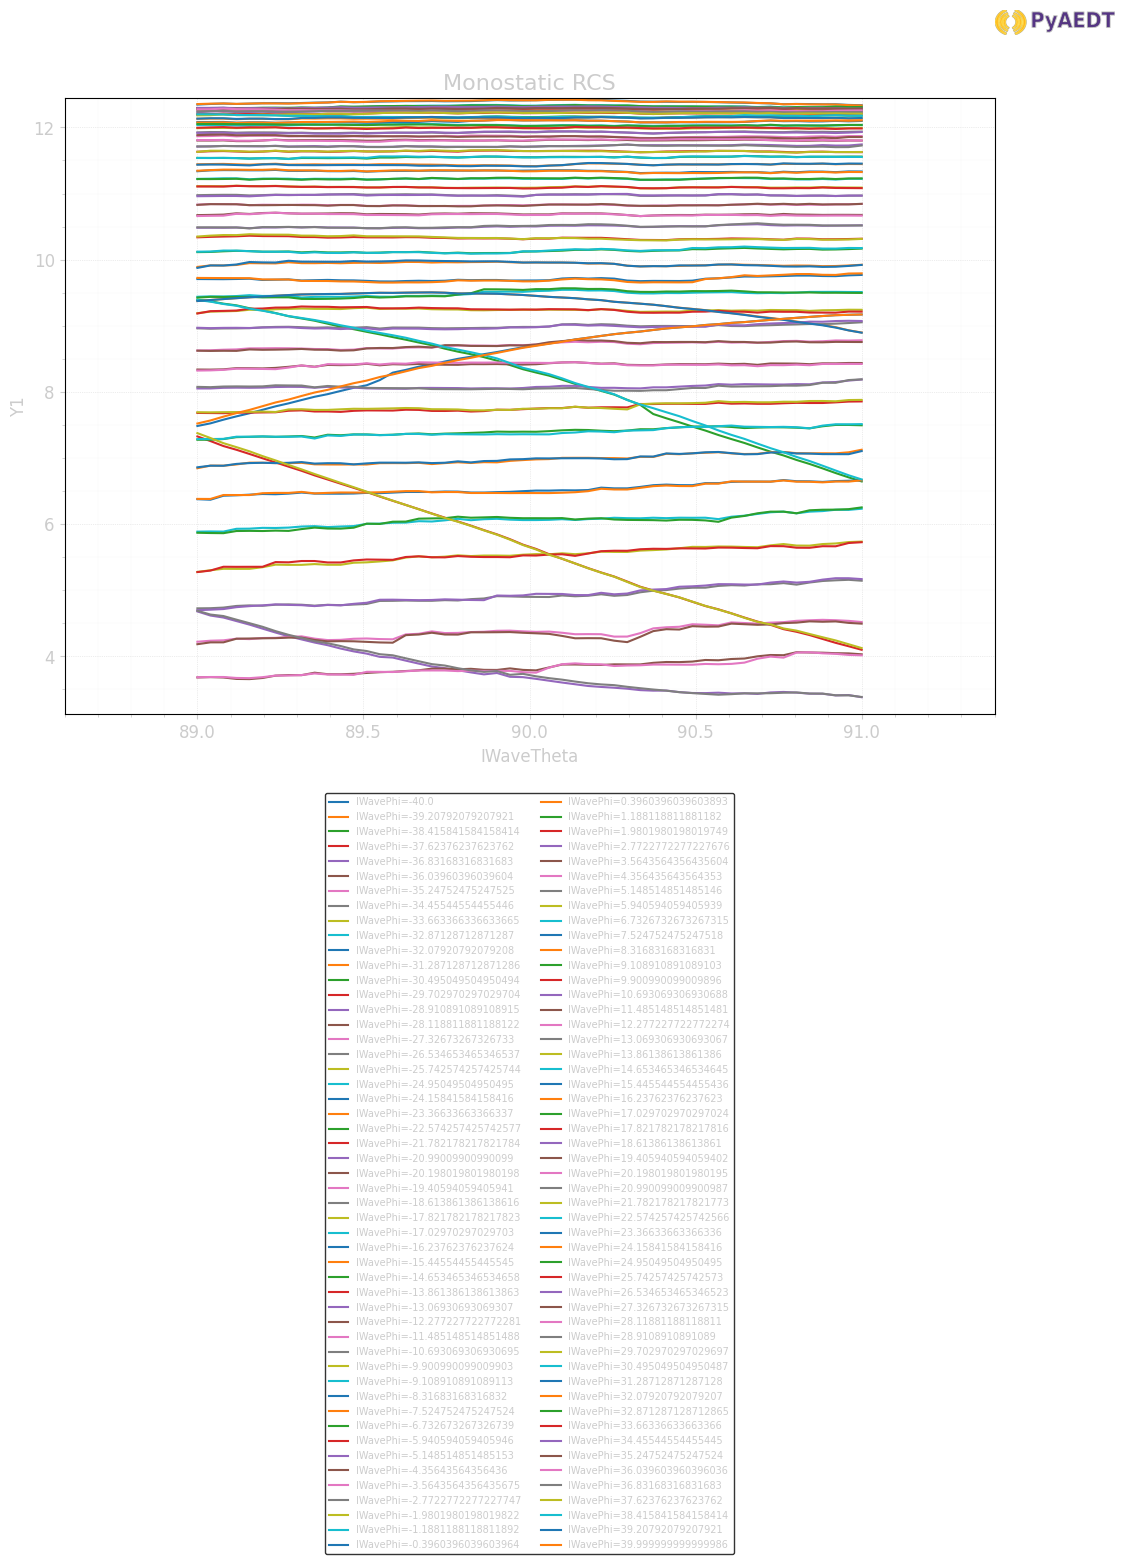
Plot all incident incident wave phi#
[12]:
primary_sweep = "IWaveTheta"
Plot RCS
[13]:
rcs_data_plotter.rcs_data.data_conversion_function = "dB10"
rcs_plot_4 = rcs_data_plotter.plot_rcs(primary_sweep=primary_sweep, secondary_sweep_value="all")
C:\actions-runner\_work\ansys-aedt-toolkits-radar-explorer\ansys-aedt-toolkits-radar-explorer\.venv\Lib\site-packages\IPython\core\events.py:82: UserWarning: constrained_layout not applied because axes sizes collapsed to zero.  Try making figure larger or Axes decorations smaller.
  func(*args, **kwargs)
C:\actions-runner\_work\ansys-aedt-toolkits-radar-explorer\ansys-aedt-toolkits-radar-explorer\.venv\Lib\site-packages\IPython\core\pylabtools.py:170: UserWarning: constrained_layout not applied because axes sizes collapsed to zero.  Try making figure larger or Axes decorations smaller.
  fig.canvas.print_figure(bytes_io, **kw)
Plot over frequency#
[14]:
primary_sweep = "Freq"
Plot RCS
[15]:
iwavephi = rcs_data_plotter.rcs_data.incident_wave_phi
rcs_plot_5 = rcs_data_plotter.plot_rcs(
    primary_sweep=primary_sweep,
    title=f"Monostatic IWavePhi {iwavephi}",
)

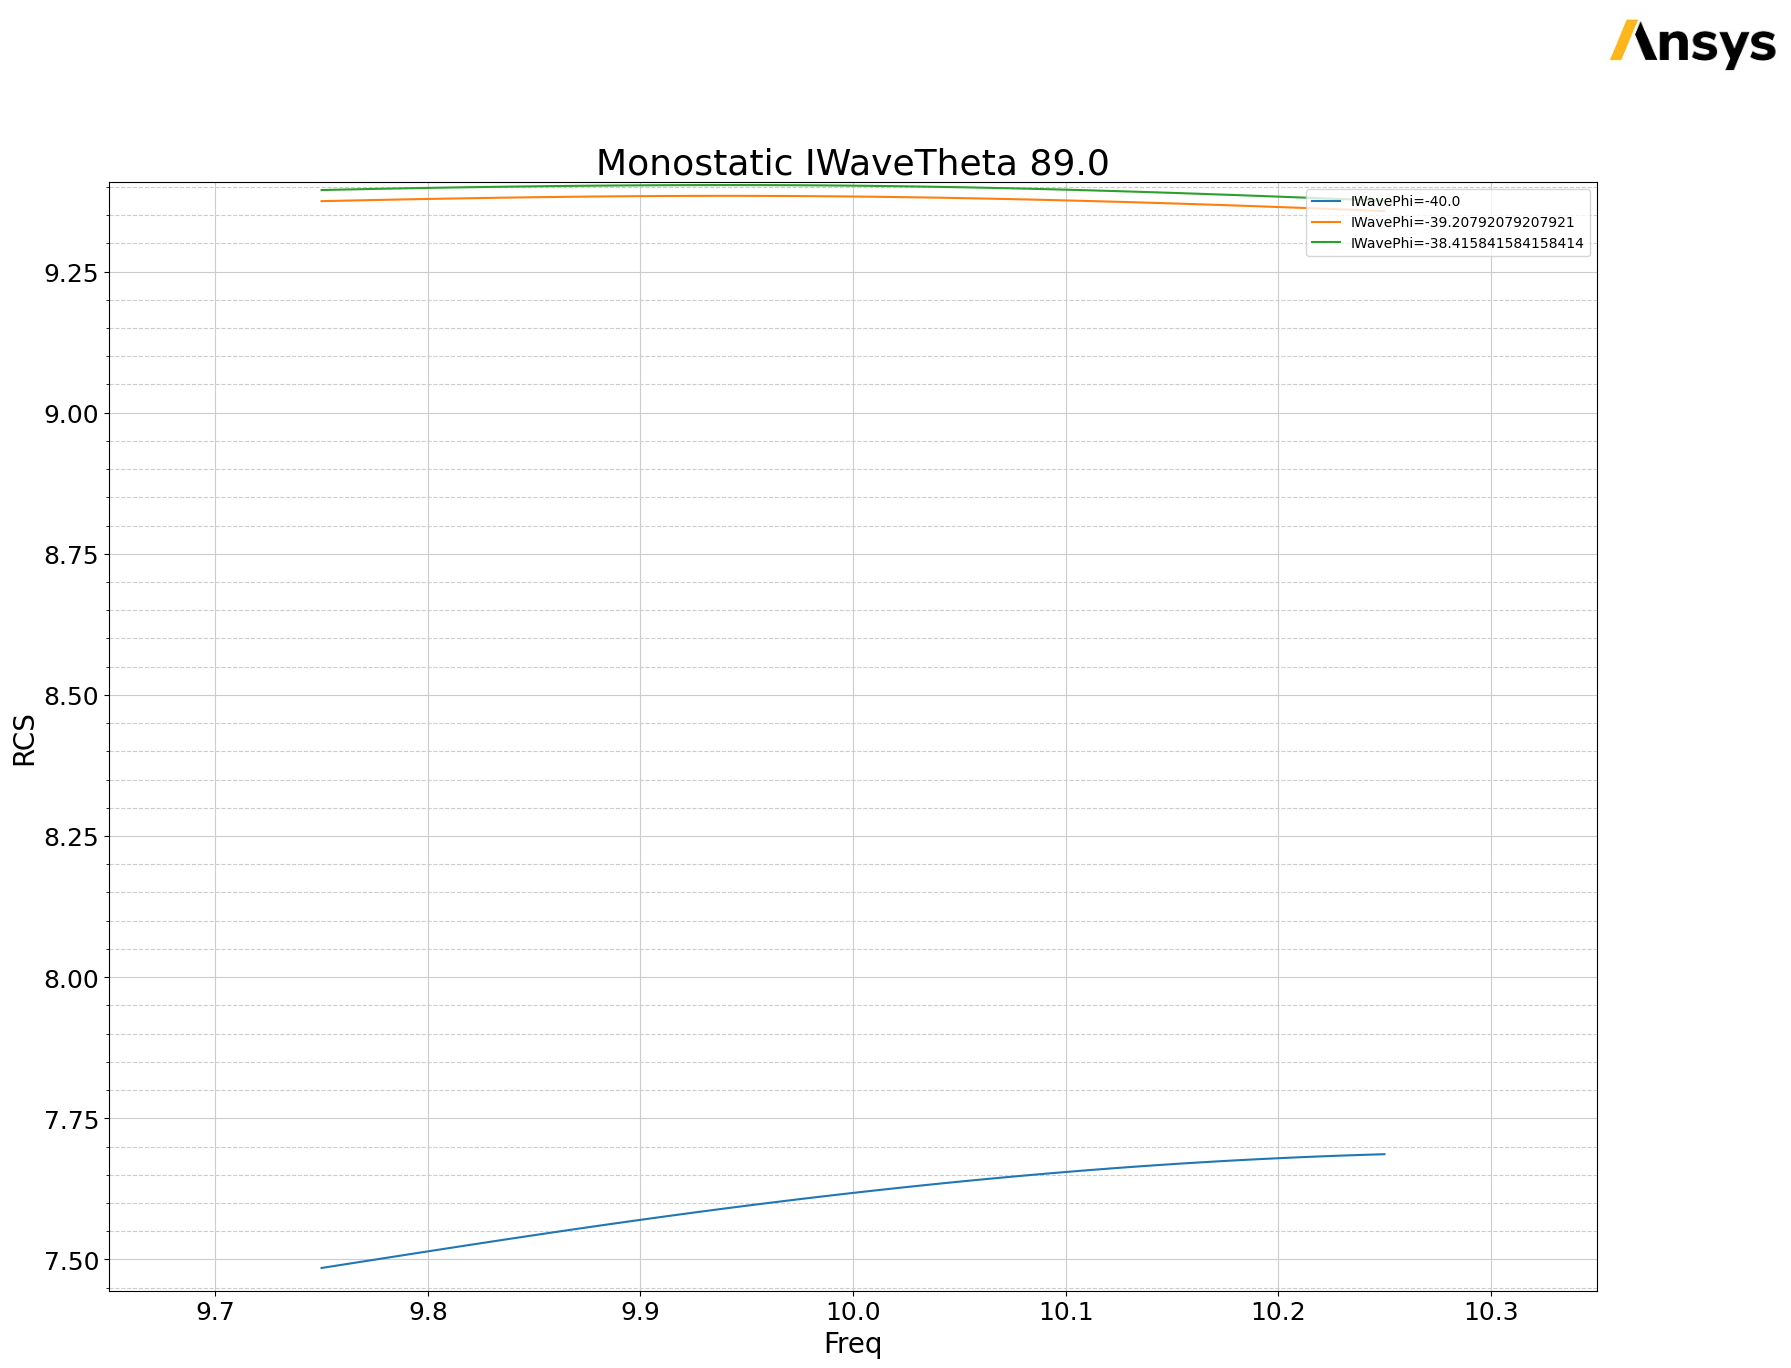
Plot RCS
[16]:
iwavetheta = rcs_data_plotter.rcs_data.incident_wave_theta
secondary_sweep_value = rcs_data_plotter.rcs_data.available_incident_wave_phi[0:3]
rcs_plot_6 = rcs_data_plotter.plot_rcs(
    primary_sweep=primary_sweep,
    secondary_sweep="IWavePhi",
    secondary_sweep_value=secondary_sweep_value,
    title=f"Monostatic IWaveTheta {iwavetheta}",
)
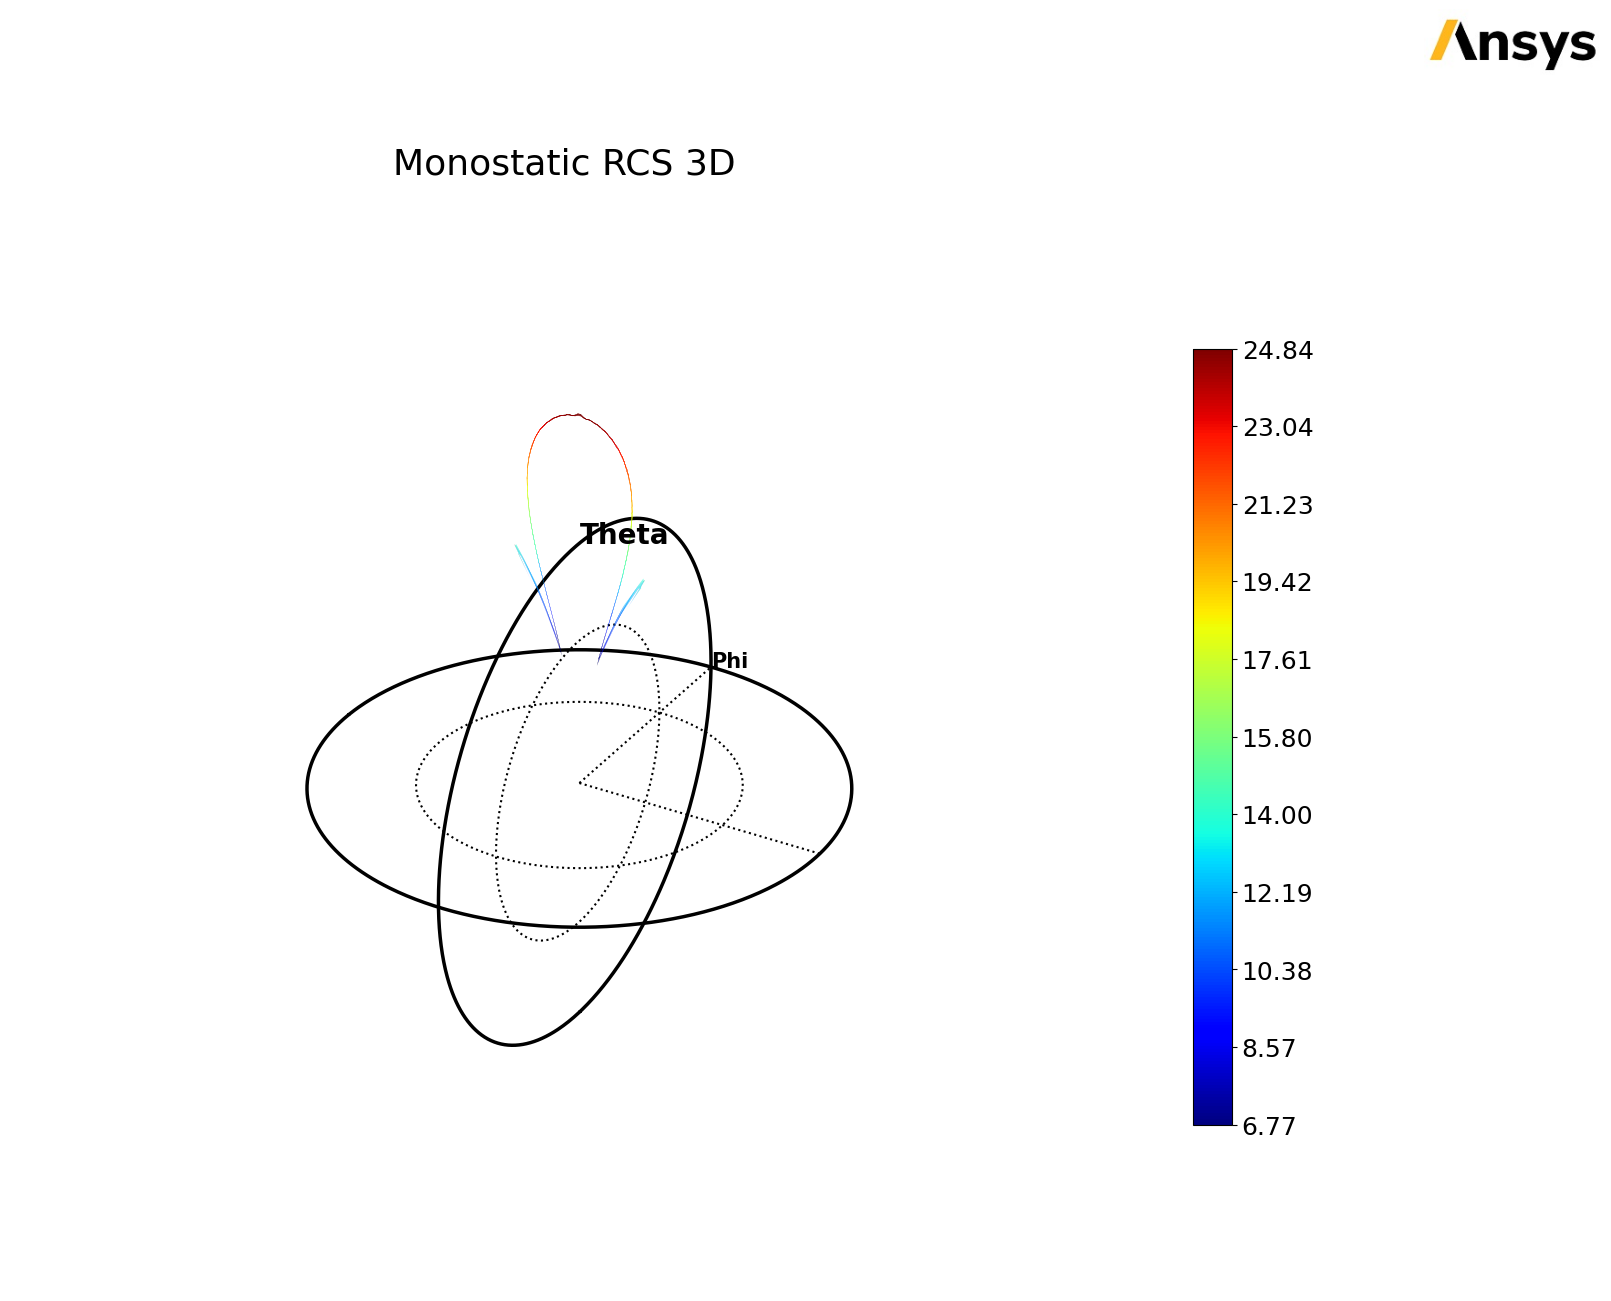
Plot 3D RCS with Matplotlib#
[17]:
rcs_data_plotter.rcs_data.data_conversion_function = "dB20"
rcs_plot_7 = rcs_data_plotter.plot_rcs_3d(show=True)
Plot RCS in scene#
[18]:
rcs_data_plotter.rcs_data.data_conversion_function = "dB20"
rcs_data_plotter.clear_scene()
rcs_data_plotter.show_geometry = True
rcs_data_plotter.add_rcs()
rcs_data_plotter.plot_scene()