Copyright (C) 2024 - 2026 ANSYS, Inc. and/or its affiliates. SPDX-License-Identifier: Apache-2.0
Licensed under the Apache License, Version 2.0 (the “License”); you may not use this file except in compliance with the License. You may obtain a copy of the License at
http://www.apache.org/licenses/LICENSE-2.0
Unless required by applicable law or agreed to in writing, software distributed under the License is distributed on an “AS IS” BASIS, WITHOUT WARRANTIES OR CONDITIONS OF ANY KIND, either express or implied. See the License for the specific language governing permissions and limitations under the License.
Generate a waterfall plot from RCS metadata#
This example demonstrates how to use the ToolkitBackend class. It initiates AEDT through PyAEDT, opens an HFSS design, and proceeds to get the antenna data.
Perform required imports#
[1]:
from ansys.aedt.toolkits.radar_explorer.rcs_visualization import MonostaticRCSData
from ansys.aedt.toolkits.radar_explorer.rcs_visualization import MonostaticRCSPlotter
Get metadata#
[2]:
metadata_vv = r"..\example_models\waterfall_data\VV_Spheres_Waterfall.json"
Load RCS#
[3]:
rcs_data_vv = MonostaticRCSData(metadata_vv)
Get waterfall data.
[4]:
data = rcs_data_vv.waterfall
Load RCS plotter#
[5]:
rcs_data_vv_plotter = MonostaticRCSPlotter(rcs_data_vv)
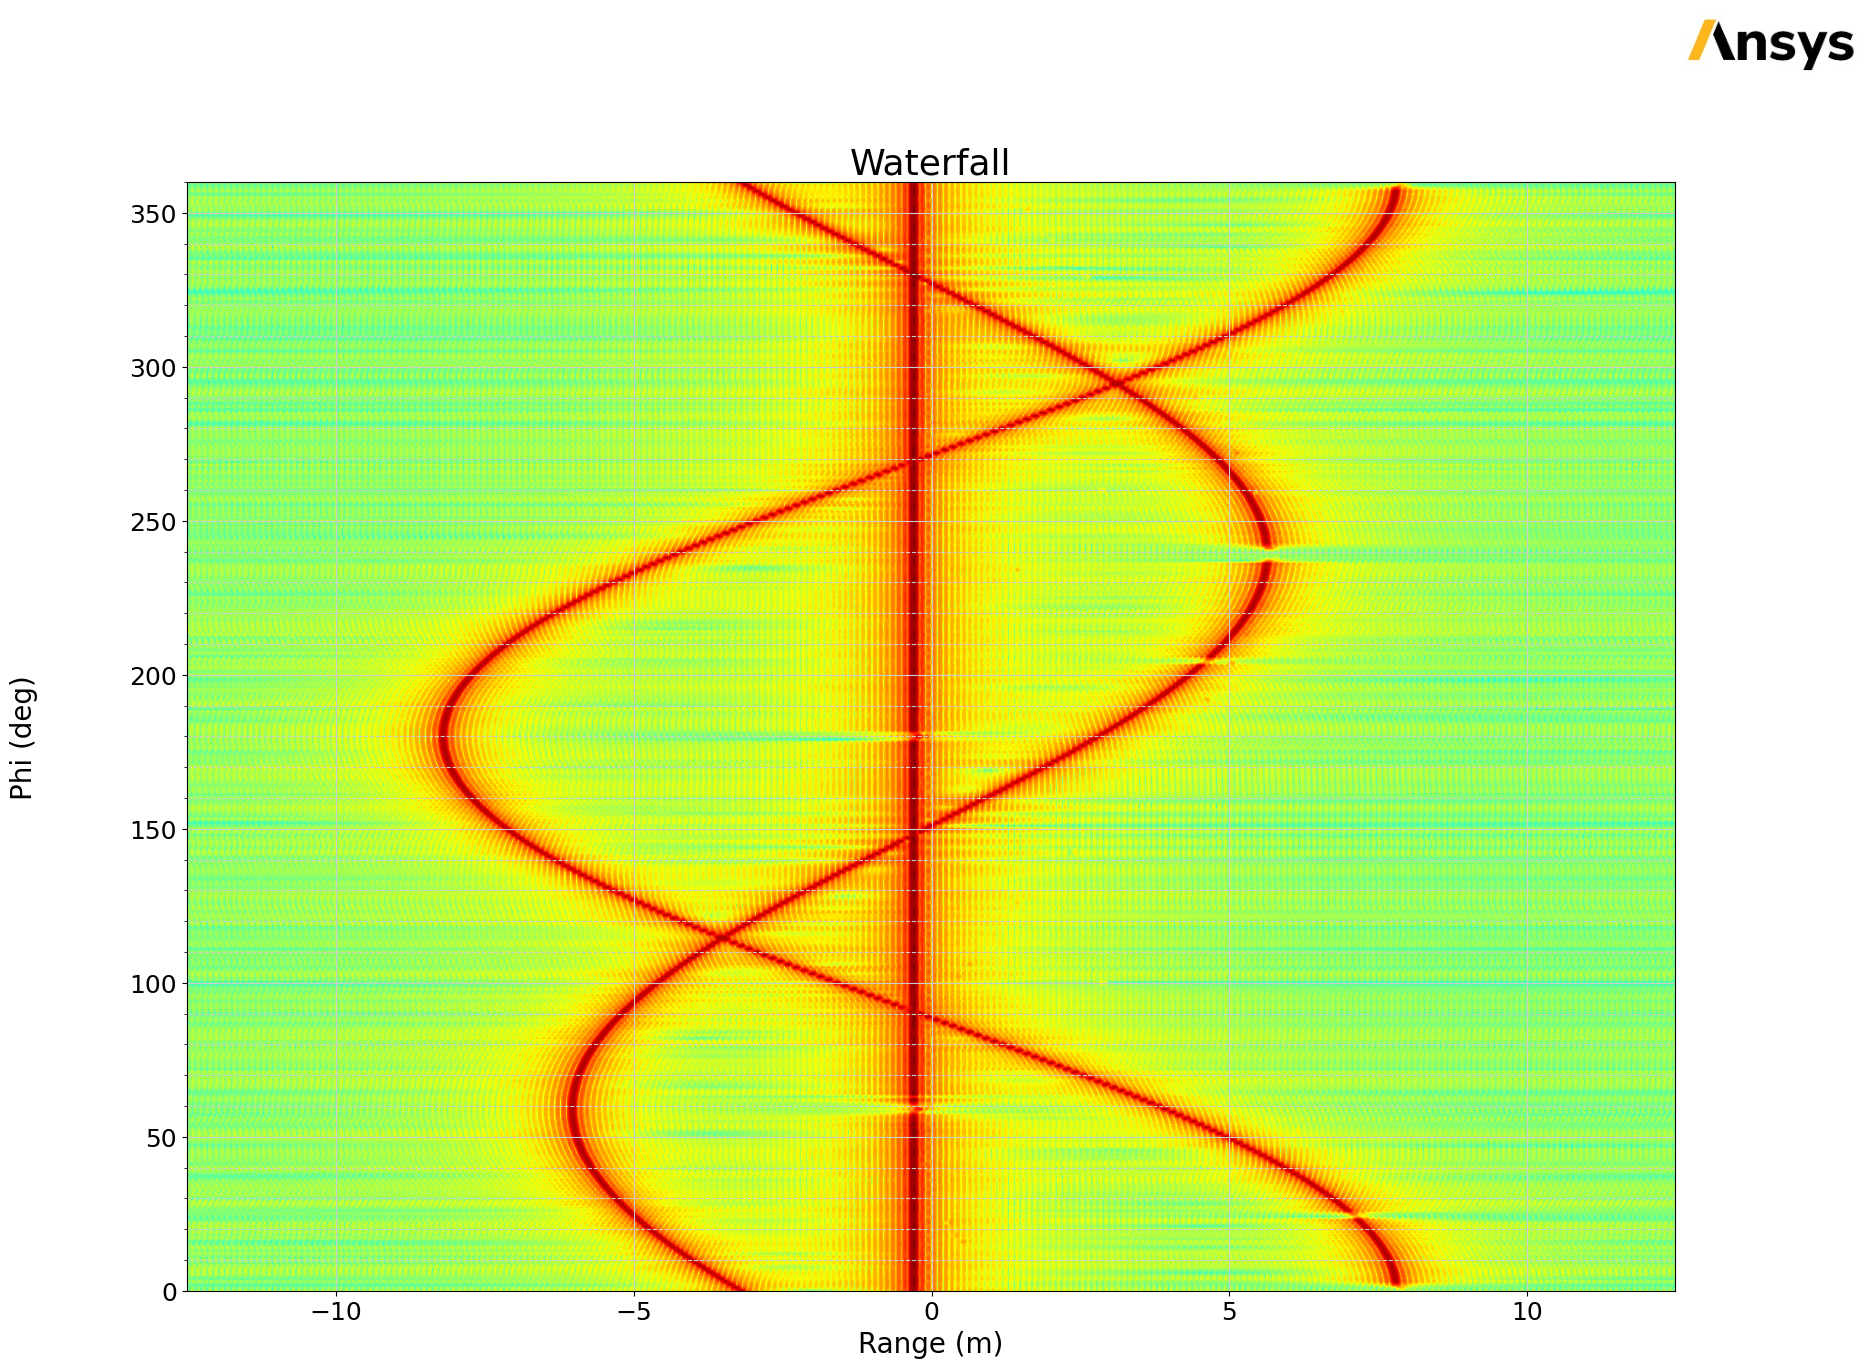
Plot 2D range profile#
[6]:
rcs_data_vv_plotter.plot_waterfall()
[6]:
Class: ansys.aedt.core.visualization.plot.matplotlib.ReportPlotter
[7]:
rcs_data_vv_plotter.plot_waterfall(is_polar="True")
[7]:
Class: ansys.aedt.core.visualization.plot.matplotlib.ReportPlotter

Plot range profile settings using internal plotter#
[8]:
rcs_data_vv_plotter.add_waterfall_settings()
rcs_data_vv_plotter.plot_scene()
Plot range profile results using external plotter#
[9]:
rcs_data_vv_plotter.show_geometry = True
rcs_data_vv_plotter.add_waterfall()
rcs_data_vv_plotter.plot_scene()
Plot range profile results using external plotter disabling one plot#
[10]:
for range_profile_actors in rcs_data_vv_plotter.all_scene_actors["annotations"]["waterfall"].values():
range_profile_actors.custom_object.show = False
rcs_data_vv_plotter.plot_scene()
Clear scene and plot range profile using internal plotter#
[11]:
rcs_data_vv_plotter.clear_scene()
rcs_data_vv_plotter.show_geometry = False
rcs_data_vv_plotter.add_waterfall()
rcs_data_vv_plotter.plot_scene()